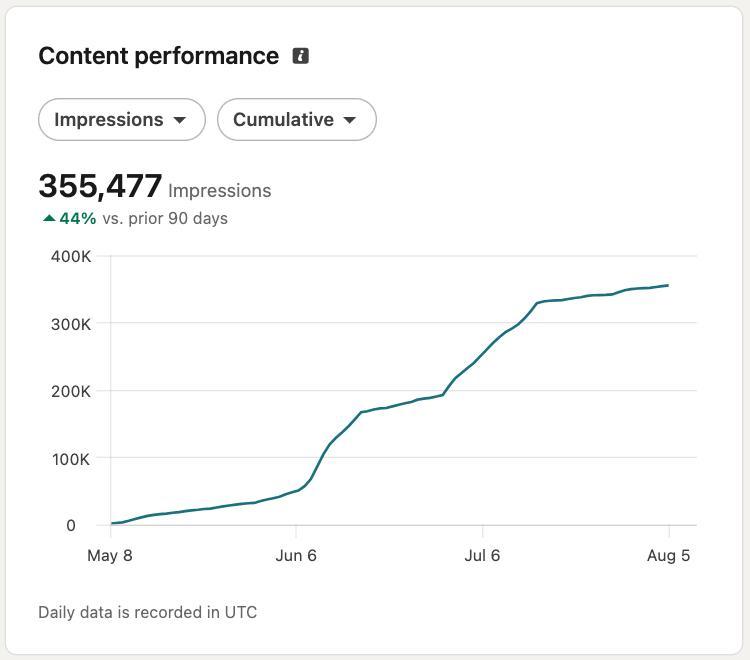
Between May 8 and August 5, a founder-led LinkedIn account generated 355,477 impressions and reached 117,521 distinct members and Pages. Eighty-two percent of those impressions came from outside the existing network.
The same 90-day report recorded 3,184 social engagements and 260 link engagements. The profile finished the period with 10,603 total followers, while LinkedIn displayed follower growth of 16% compared with the previous 90 days.
This LinkedIn content case study uses the four original screenshots from the source report. The images have not been recreated, redrawn, or changed. The account is anonymized because the report does not include public authorization to identify it.
The 90-day LinkedIn performance snapshot
LinkedIn displayed a 44% increase versus the previous 90-day period.
Distinct members and Pages reached, with repeat displays excluded from this count.
Only 18% of impressions came from followers and existing connections.
Reactions, comments, reposts, saves, and sends recorded in the report.
Fifty premium custom-button engagements and 210 visits to links in posts.
The account displayed 16% follower growth versus the prior 90 days.
Reach extended far beyond the existing network
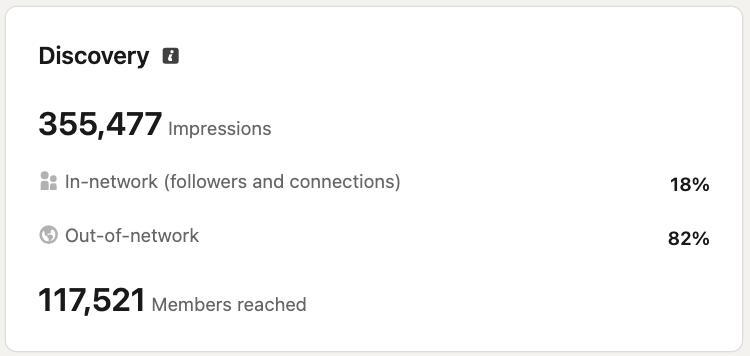
The discovery split is the most useful number in the report. Out-of-network impressions accounted for 82% of the total, compared with 18% from followers and connections. Based on the rounded shares LinkedIn displays, the out-of-network share was about 4.6 times the in-network share.
The 355,477 impressions divided by 117,521 members reached produce a simple average of 3.02 impressions per reached member or Page. That is not a frequency metric published by LinkedIn, and both inputs are estimates. It does show that the total was not built only from one display per viewer.
For a founder-led content system, that distinction matters. Existing followers can validate a post, but growth depends on the content travelling beyond the audience already connected to the account. The data shows that distribution happened here.
Engagement was more than reactions
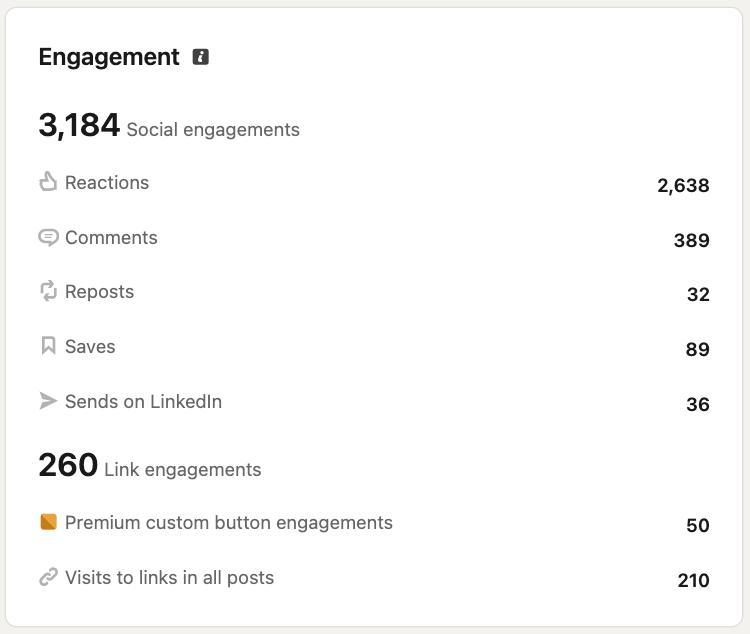
The social engagement total reconciles exactly: 2,638 reactions, 389 comments, 32 reposts, 89 saves, and 36 sends add up to 3,184. Dividing that total by impressions produces a simple social-engagement-to-impression ratio of 0.90%.
That calculated ratio should not be confused with a platform-reported engagement rate. LinkedIn notes that analytics are estimates and that removed interactions can affect combined engagement totals. It is still a useful internal comparison when the same definition is applied across periods.
The 389 comments are especially useful because they represent conversation, not just low-friction acknowledgement. Saves and sends are smaller in absolute terms, but they can indicate that people considered the material worth keeping or sharing privately.
Follower growth continued across the period
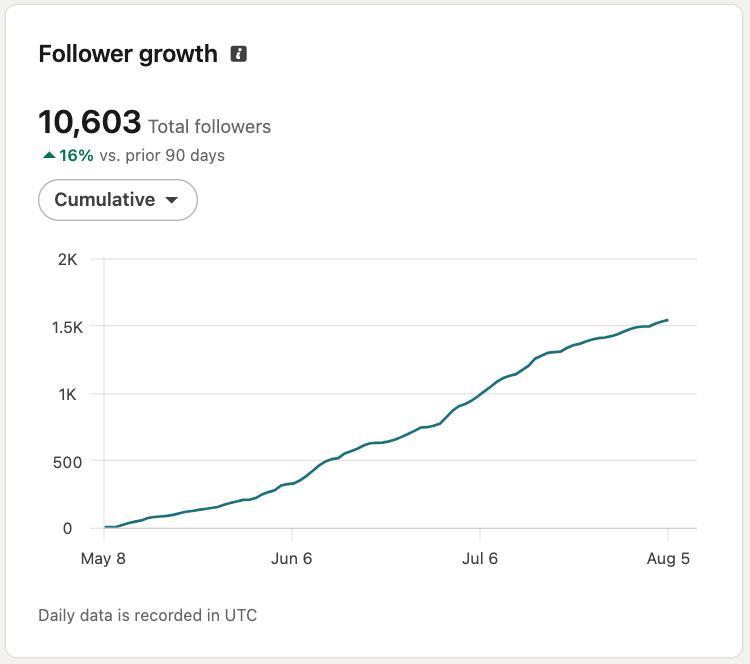
The cumulative chart rises throughout the window, with faster growth around early June and early July. That pattern matters because it shows bursts rather than a perfectly smooth line. Strong content distribution is usually uneven, and aggregate totals can hide the few periods that contribute a disproportionate share of growth.
The next layer of analysis should therefore be post-level. The combined report tells us that reach and follower growth occurred, but it does not identify which topics, formats, hooks, or publishing times caused each jump.
What this LinkedIn case study proves
- A founder-led account can reach well beyond its existing followers and connections.
- The 90-day content portfolio produced measurable reach, conversation, saves, sends, and link activity.
- Distribution and follower growth happened across the period, with visible acceleration during specific intervals.
- The reported totals are internally consistent across the original discovery, engagement, follower, and content-performance screenshots.
What the screenshots do not prove
- They do not attribute the results to one post, topic, format, or publishing schedule.
- They do not show leads, booked calls, pipeline, or closed revenue.
- They do not separate organic and boosted performance, so this article does not claim the distribution was entirely organic.
- They do not identify unique link visitors because LinkedIn says link engagements can include repeat clicks.
- They do not prove that another account will reproduce the same result.
The honest conclusion: the account built broad awareness and sustained audience growth. A revenue claim would require CRM attribution, lead-source tracking, and destination readback that are not present in this report.
How to turn this visibility into outbound leverage
Reach alone is not a sales system. The practical move is to connect content with profile positioning, engagement signals, and a controlled outbound handoff.
- Align the profile with the offer. A prospect who discovers a post should understand the problem you solve before reading three sections of the profile. Use the LinkedIn profile match audit before scaling distribution.
- Treat posts as searchable proof. Build recurring content around buyer problems, operator decisions, and first-party evidence. The system is explained in LinkedIn Is a Search Engine.
- Capture engagement without duplicating the pitch. When someone engages, move the signal into a clean handoff that respects prior context. See the LinkedIn engagement-to-cold-email workflow.
- Measure the whole chain. Keep creator analytics, profile visits, replies, meetings, opportunities, and revenue separate so an awareness win is not relabelled as pipeline.
What do LinkedIn impressions mean?
LinkedIn defines impressions as the number of times a post was displayed on screen. Impressions can include repeat displays. Members reached is the estimate of distinct members and Pages that viewed the content, so it is the better companion metric when evaluating the breadth of distribution.
How do LinkedIn impressions work in combined analytics?
Combined post analytics aggregate the performance of the content portfolio for the selected date range. LinkedIn allows creators to switch between daily and cumulative views and compare the selected range with the previous range. LinkedIn also states that analytics numbers are estimates and may not be precise.